
Biophysical studies of anthrax toxin translocation
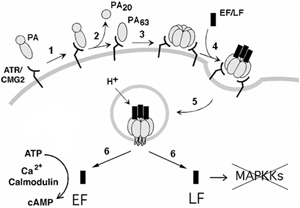
Fig 1. Anthrax toxin internalization. 1, PA binds to a host cell receptor; 2, proteolytic activation of PA and dissociation of a small 20-kDa fragment; 3, self-association of PA63 monomers forms a heptameric prepore; 4, EF and LF bind the prepore; 5, endocytosis; 6, acid-induced conversion of the prepore to a transmembrane pore through which LF/EF translocate into the cytosol. Moreover, these acidic pH conditions cause LF and EF to unfold into molten-globule forms and generates a proton gradient that drives translocation. The now cytosolic enzymes, LF and EF, refold, catalyzing the cleavage of MAPKKs and formation of cAMP, respectively. These enzymatic activities can disrupt or kill the target cell.
Background. Anthrax toxin (Atx, Fig. 1), which is a major virulence factor secreted by Bacillus anthracis, is an ideal model system to study protein translocation. It is composed of three proteins—a translocase channel component and two different enzyme components—that may be produced recombinantly in soluble form and studied independently. Protective antigen (PA; 83 kDa) ultimately forms a channel that transports, to the cytosol of a mammalian host cell, two enzymatic components: lethal factor (LF; 90 kDa), a Zn-protease, and edema factor (EF; 89 kDa), a Ca2+- and calmodulin-activated adenylate cyclase. While these three protein components are individually nontoxic, mixtures of these components can form two different types of toxic complexes: lethal toxin (LT, PA plus LF) and edema toxin (ET, PA plus EF). In either case, these individual components must assemble for the toxin to properly function. Fig. 1 shows how toxin complexes assemble on target cell surfaces, forming a ~0.5 MDa complex, containing a heptameric or octameric ring-shaped PA oligomer and up to three or four copies of LF and/or EF. This complex (known as the prechannel complex) is engulfed by the cell within an endosome. Acidic pH conditions produced inside the endosome trigger a series of steps. First, the PA prechannel oligomer converts into a channel that inserts into the endosomal membrane. The transmembrane portion of the channel has as a β-barrel structure, forming a narrow pore thought to be as wide as the diameter of an α-helix. Second, acidic endosomal conditions cause LF and EF to shed their bulky tertiary structure, allowing the proteins to enter the narrow channel. Specifically, their amino-terminal domains (LFN or EFN; ~250 residues) acid-denature, forming molten-globular (MG) structures with >60% of their native buried surface exposed. Third, acidic endosomal conditions generate a transmembrane proton gradient (ΔpH), which drives further LF and EF unfolding and translocation of the unfolded chain through the channel. Efficient coupling of the transmembrane ΔpH driving force requires a catalytic active site in the channel composed of a narrow ring of phenylalanine residue. This site, called the φ clamp, forms a narrowly apposed substrate clamping site in the central lumen of the PA channel, and it allows the channel to catalyze unfolding and translocation presumably by forming transient interactions with the unfolded translocating chain. Once in the cytosol of the host cell these enzymes catalyze reactions that disrupt normal cellular physiology. LF cleaves mitogen activated kinase kinases, disrupting cell signalling pathways and causing macrophage lysis, immune system suppression, and death. EF catalyzes the formation of cAMP, elevating its levels 200 fold in cells, leading to tissue swelling and causing death in a manner distinct from LT. [top]
PA forms heptameric & octameric oligomers
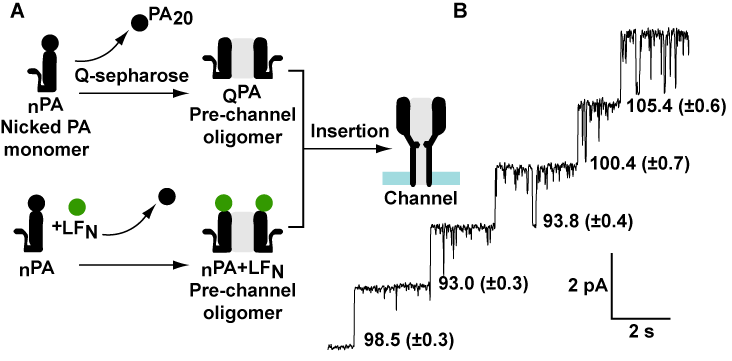
Fig 2. Two different PA channel sizes. (A) Two PA samples were analyzed: (i) PA is nicked by trypsin to make nPA; a 20-kDa piece (PA20) dissociates, allowing PA to oligomerize into the pre-channel on a Q-sepharose column, making QPA; and (ii) nPA is mixed with LFN to drive oligomerization, making nPA+LFN. Either pre-channel oligomer forms a channel upon inserting into the membrane. (B) Example of a 200-Hz-filtered, single-channel record collected at a ΔΨ of 20 mV, 100 mM KCl, pH 6.60. Single-channel conductances (γ values) are computed by γ = i/ΔΨ are listed next to each channel insertion, where i is the single-channel current and ΔΨ is the membrane potential.
Assembly is paramount to Atx function and its cellular internalization. PA, LF and EF are individually nontoxic; however, once these subunits assemble they form toxic complexes. Two possible assembly routes are known. In one possible assembly mechanism, PA forms complexes on the surface of host cells in a receptordependent manner. PA first binds to one of two known Atx receptors (ANTXR1 and ANTXR2). PA is then cleaved by a furin-type protease to make the proteolytically activated form, called nPA. After a 20 kDa portion of nPA (PA20) dissociates, the remaining 63-kDa (PA63) receptor-bound portion assembles into a ring-shaped oligomers. Traditionally, these oligomeric rings have been characterized as heptameric oligomers. The prechannel heptameric oligomers can bind up to three LF and/or EF molecules, respectively.
ANTXR are slowly internalized by the host cell, but PA-bound ANTXR can internalize rapidly once it dimerizes, making proper oligomerization a critical step in the internalization pathway. ATR is dimeric, further complicating the assembly mechanism, since PA oligomers are believed to be odd-numbered and heptameric. ANTXR2 and Atx were recently implicated as factors that help the B. anthracis bacterium escape the acidic phagolysosome following spore germination, suggesting Atx components may assemble in hostile environments as well. Another potentially interesting extracellular assembly mechanism has become apparent in the investigation of animals infected with B. anthracis, where it has been shown that anthrax toxin accumulates in the blood of animals. Specifically, LF is found alongside proteolytically-activated nPA, implying that the PA is potentiated for assembly. Relative to toxin produced in vitro, the toxin produced in vivo (i.e., isolated from the blood of animals suffering from anthrax) forms unique assemblies as evidenced by their unique resistance to antibody binding, and the in vivo derived toxin is more lethal.
PA can form two different channel sizes. PA channels were inserted into planar lipid bilayers following one of two different assembly methods outlined in Fig. 2A. A pre-oligomerized sample, called QPA (trypsin-nicked PA assembled on Q-sepharose anion-exchange resin) was applied to the bilayer, and discrete single-channel steps were observed (Fig. 2B). QPA channels had a mean conductance of 95.5 pS (n = 360). Single-channel conductance values (γ) for wild type (WT) PA channels were reported to range from 85 to 110 pS. We also observed that the QPA sample contained two discrete channel sizes: a prevalent, smaller one and a rarer, larger one. The overall γ-value distribution recorded from many individual membranes was broad (Fig. 2C).
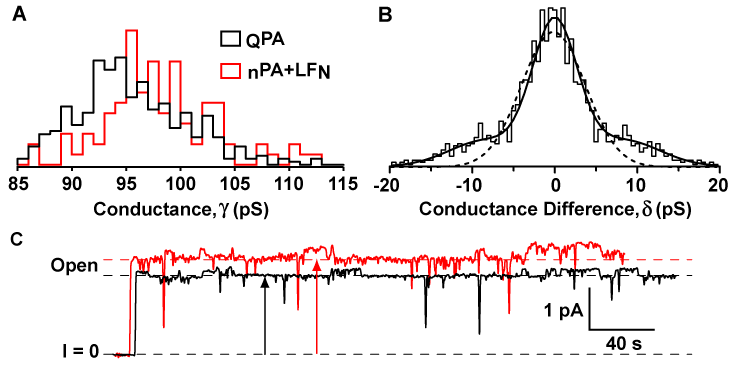
Fig 3. Analysis of PA single-channel records. (A) Normalized histograms of the estimated single-channel γ values for the QPA and nPA+LFN samples. Data bins are one-pS wide, and the number of channels, n, in each sample are normalized for comparison. The samples, QPA (n = 360; black bars) and nPA+LFN (n = 107; red bars), are statistically distinct by a non-parametric, lower-tailed, Whitney-Mann test (p > 0.95). (B) Histogram of all the pairwise differences, δ, between measured γ values identified within the same membrane for the nPA+LFN sample. The δ histogram was fit to one- (dotted line) and two-Gaussian (solid line) functions, using A(δ) = A1/σ1√(π/2) exp(–2δ2/σ12) + A2/σ2√(π/2) [exp(-2((δ – μ2)/σ1)2) + exp(–2((δ + μ2)/σ1)2)], with R values of 0.89 and 0.96, respectively, yielding best-fit parameters: peak area A1 = 470 (±80), A2 = 140 (±40); mean, μ2 = 8 (±2) pS; and standard deviation, σ1 = 5.5 (±0.5) pS, σ2 = 9 (±2) pS. (C) Single-channel current records for smaller- (black) and larger-sized (red) PA channels in 100 mM KCl, pH 6.6. Arrows indicate the two respective channel sizes. Data were acquired at 400 Hz and filtered further with a 100-point-per-σ Gaussian filter to better reveal conductance sub-states.
To determine if the method of PA assembly affected the γ-value distribution, we studied trypsin-nicked PA (nPA) samples assembled in the presence of LF’s amino-terminal domain (LFN), called nPA+LFN. Again, larger-conductance channels appeared among smaller-conductance channels in two discrete sizes, but the frequency of observing larger channels increased. The mean γ value for nPA+LFN [98 pS (n = 107)] increased relative to that observed for QPA. Moreover, a lower-tailed Whitney-Mann test shows that QPA and nPA+LFN distributions are unique from one another (p > 0.95). Finally, three separate QPA samples contained a consistently lower mean conductance of ~95 pS relative to two other nPA+LFN samples, which had a mean conductance of ~98 pS. Thus the method of assembly shifts the single-channel-conductance distribution (Fig. 2C).
Inherent variability in bilayer thickness, combined with the presence of another more-conducting conformation, likely contributes to the broad aggregate distributions (Fig. 2C). To mitigate this, we examined the discrete differences in channel conductance within each membrane by tabulating the set of all the pairwise differences (δ) in γ values per membrane, {γi – γj}, where i ≠ j. A histogram of δ values recorded for the nPA+LFN sample shows that two sizes of channel conductance are present, as the distribution fits best to a two-Gaussian distribution (Fig. 2D). Based upon our fit, these two populations of γ values differ from one another by 8 (±2) pS, or about ±10%, where the larger-sized conductance state represents 25 (±6)% of the population. This result led us to conclude that PA forms two discrete conductance states that may be differentially populated, depending upon the method of assembly.
We tested whether larger-conductance channels were a substate of less-conducting channels due to a conformational rearrangement. To test this possibility, we measured ~6-minute-long recordings of single channels (Fig. 2E). While fluctuations to a more conducting substate are observed, these fluctuations are relatively small; and large-conductance channels (>102 pS) did not interconvert to smaller ones (<95 pS) during these and all other recordings. Therefore, either two unique channel sizes exist in PA samples or the timescale of the conformational rearrangements between the large- and small-conductance states is slow.

Fig 4. Two different PA oligomers observed by EM. EM images of negative-stained samples of WT PA oligomers assembled either in vitro (A-C) or in vivo on cell surfaces (lower panel). Representative class averages of octamers (left) and heptamers (right) are shown. The total number of particles assessed, n, and relative percentages of heptamers and octamers are given. The proportions of heptamers and octamers are indicated by bars colored black and red, respectively. In vitro samples include: (A) nPA assembled on an anion-exchange column (QPA; n = 12589; 98% heptamer; 2% octamer); (B) nPA assembled in the presence of soluble dimeric ANTRX2 at a 4:1 stoichiometry (+dsANTRX; n = 837; 74% heptamer; 26% octamer); (C) nPA assembled in the presence of LFN; (+LFN; n = 8409; 72% heptamer; 28% octamer).Oligomers extracted from cells: (D) His6-PA assembled on cells expressing ANTRX2 (C-CHO; n = 4729; 74% heptamer; 26% octamer), where three classes of octamers and heptamers are shown, resulting from reference-based analysis. The 5-nm scale bar shown in (A) is consistent for all images. Percentages of oligomers are means of reference-free and crystal-structure-referenced alignments unless noted otherwise.
Electron microscopy studies reveal PA forms heptamers and octamers. Under the assumption that the ~10% difference in conductance states may correspond to slow-timescale structural changes in the channel diameter, we examined the QPA oligomers for structural heterogeneity by electron microscopy (EM). Reference-free analysis of ~104 negatively-stained particles identified two classes of ring-shaped oligomers—the heptamer and a novel octamer (Fig. 3A). We then hypothesized that the stabilization of dimeric PA complexes could favor octamer formation. We found that PA pre-complexed to dsANTRX2 (Fig. 3B), but not to monomeric ANTRX2, showed increased proportions of octamers upon assembly. Further studies demonstrated that when dsANTRX was loaded under less saturating conditions, the octamer levels decreased. Thus the more saturating conditions allow the dsANTRX2 sites to fully populate with PA prior to assembly, which increases the probability of forming the even-numbered, octameric form. LF or EF can form a ternary complex with PA dimers, thereby stabilizing the dimeric PA intermediate. We have also observed this species in mass spectrometry experiments. When LFN or EFN is used to assemble nPA into oligomers (Fig. 3C), ~25% of the population became octameric. This increase is five- to ten-fold more than that observed for PA oligomerized in the absence of LFN or EFN.
PA forms octamers and heptamers on cell surfaces. These in vitro results led us to probe the oligomerization pathway on cell surfaces. We used a Chinese hamster ovary (CHO) cell line, expressing ANTRX2, called C-CHO. PA with a carboxy-terminal six histidine tag (His6), called His6-PA, was added to the extracellular medium of cultured C-CHO cells and incubated to assemble. Endosomal acidification was blocked with ammonium chloride to prevent the conversion of the pre-channel oligomers to the channel state. The cells were harvested, lysed in detergent and purified on His6-affinity resin. EM studies of these extracts identified oligomeric rings consistent with the size and shape of PA oligomers; however, these complexes were less well oriented than the other in vitro samples, perhaps due to the presence of cellular components, like full-length ANTRX, which may form the observed extensions from the oligomeric structure. Several tilted class averages were obtained to capture this heterogeneity. From these, we determined that ~20-30% of the oligomers were octameric (Fig. 3D). Thus PA forms a mixture of octamers and heptamers on cell surfaces.
Structure of the PA octamer (3HVD)
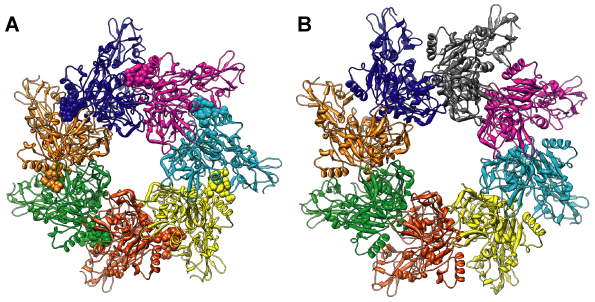
Fig 5. PA oligomer structures. Axial views of (A) the WT PA heptamer (PDB 1TZO) and (B) the PAΔMIL octamer (PDB 3HVD). PA monomer subunit chains are colored uniquely.
Source of PA octamer for structural studies. Mutations introduced into PA identified that a disruption of the interface between two PA subunits at the interface of domain 4 (D4) and the neighboring membrane insertion loop (MIL) affected PA assembly. One mutant replaced the MIL (i.e., residues 305-324) with a type II turn, deleting all possible hydrophobic interactions between L668 of D4 and F313 and F314 in the MIL. This type of PA oligomer (PAΔMIL) was previously reported to form heptameric rings (as shown for the wild type (WT) PA heptamer, Fig. 3A); however, our version made an enriched source of octameric rings as observed by electron microscopy (EM).
The crystal structure of the PA octamer. We used PAΔMIL oligomers as a concentrated source of octameric PA, and solved its crystal structure to 3.2-Å resolution (Fig. 3B; Table S3). Molecular replacement identified eight PA monomers arranged as a ring in the asymmetric unit. We find that the octamer is best described as having fourfold noncrystallographic symmetry (NCS), because there are two types of PA monomer conformations [called A and B (Fig. 4C)] that occupy alternating positions around the ring (Fig. 4D). From structural alignments, these two conformers differ in the orientation of D4 (Fig. 4C). This conformational heterogeneity is notable, since D4 interacts with the MIL and may be a structural feature in the assembly mechanism. D4’s flexibility is also consistent with the higher than average B factors observed there and also in the MIL of the heptamer structure. Thus plasticity in these two regions may provide a mechanism for octamer formation, where modulation of the structure in these regions may occur either (i) via ATR binding, which reorients D4 relative to D2; or (ii) via exposure to a more acidic pH, which may alter the conformation of the MIL.

Fig 6. Details of the PA octamer structure. (A) A backbone alignment of two adjacent PA monomers, chains A and B, called conformation A (red) and B (blue), showing the displacement of D4. (B) Superimposed on a surface rendering of half an octamer is the square planar arrangement of symmetrically related A and B conformers calculated from the positions of each chain’s center of mass. Chains A, C, E, G are conformation A; and chains B, D, F and H are conformation B. Adjacent A-B pair center of masses are 64.3 (± 0.1) Å apart at angles of 90 (±0.1)º. Domains are colored as: D1' (magenta), D2 (green), D3 (gold), and D4 (blue). (C) An A-B oligomerization interface split apart to compare relative differences in surface area burial at the oligomerization interface of the heptamer and octamer structure among the four domains. The domains (upper panel) are colored as in (B). The relative degrees of surface area buried (lower panel) are colored as follows: surface buried equally (i.e., to within 10%) in either structure (green); surface buried 10% more buried in the heptamer (red); surface buried 10% more in the octamer (blue); and surface buried <75% in both structures (white). All molecular graphics were rendered using CHIMERA.
Consistent with our single-channel data, the mean pore diameter of the octamer pre-channel is ~10% larger than the heptamer [46 (±4) and 40 (±4) Å, respectively] (Fig. 3A,B). The residues lining the pre-channel of the octamer are similar to those in the heptamer; all types of chemistries are represented, though the charge composition is more anionic overall. The octamer buries ~3300 Å2 of solvent accessible surface area (ΔASA) per monomer, which is ~800 Å2 less than the heptamer; the MIL and its interactions with its neighboring docking groove in D4 largely account for this difference. The octamer forms additional contacts (not found in the heptamer) at sites more proximal to the central pore, accounting for ~350 Å2 of additional buried surface per dimer interface (Fig. 4E). For WT octameric PA, the MIL should form analogous interactions with this D4-docking groove; and therefore, the octamer may bury at least 350 Å2 more surface area per monomer than the heptamer when the MIL is present. Thus WT octamer will bury ~6100 Å2 of additional surface relative to the heptamer, when including the eighth subunit and additional increases in burial per monomer.
The angles, θ, between n adjacent monomers arranged symmetrically about a ring are ideally equal to 180 - 360/n, and these angles widen ~6º for the octamer (Fig. 4A) with respect to the heptamer (Fig. 4B). We found this is accomplished by a subtle shift in the inter-monomer packing interfaces (Fig. 4E), where the octamer buries more surface area in regions proximal to the central channel. During assembly, the steric mass of the MIL may act as a non-specific wedge that effectively nudges the adjacent monomer toward a more acute θ in the heptamer. Thus PAΔMIL, in the absence of this constraint, is able to relax θ to achieve the octameric configuration. The MIL has two functions: (i) to form the channel in the membrane; and (ii) to control the oligomerization number of pre-channel assemblies.
LF & EF are destabilized under acidic pH conditions

Fig 7. Using FRET to probe LFN unfolding. (A) Structure of LFN, residues 27-263 of LF with a modeled amino-terminus: α-helix (blue; 42%), β sheet (green; 13%), and loop/coil (gray; 46%). FRET dyes, AF488 and AF546, are attached at residues 14 and 242, respectively. All 14 native Tyr residues are also depicted. (B) Fluorescence spectra of LFN* (ex. 488 nm argon-ion laser line) in the absence (solid line) and presence (dashed line) of 3 M GdmCl, pH 8. (C) FRET-probed GdmCl profiles at 20 °C for LFN* at different pH conditions. Signals (normalized ratio of emission intensity at 520 and 570±16 nm) are fit to a four-state model: N ↔ I ↔ J ↔ U. Profiles are normalized such that the unfolded signal is zero and the native signal is unity.
How do LF and EF unfold in order to translocate through a narrow channel? Little was known about the physical mechanism of protein unfolding and translocation, except that the β-barrel pore is so narrow that LF or EF would have to unfold. Since the endosomal compartment acidifies, we explored the effect of low pH on the native structures of the amino-terminal domains of LF and EF (LFN and EFN, ~30 kDa each), which are the PA-binding domains and minimal units required for translocation in cellular assays.
Using equilibrium chemical denaturant titrations to probe LFN and EFN unfolding. By a variety of spectroscopic methods, including fluorescence resonance energy transfer assay (FRET), circular dichroism (CD, Fig. 7), and native fluorescence, we found that acidic pH conditions destabilized the native state (N) of LFN and EFN, causing either domain to populate a molten globule (MG) intermediate (I). Overall these proteins unfolded via a four-state thermodynamic mechanism: N ↔ I (MG) ↔ J ↔ U, where J refers to an expanded nearly unfolded state (U). The MG showed a loss of tertiary structure burial and exposure of apolar surface but retention of helical secondary structure. Linked equilibrium thermodynamic analysis distinguished the type of residues in the domains that are protonated and comprised the pH-dependent unfolding ‘trigger’; pKa’s expected for histidine residues were associated with the trigger. Both LFN and EFN reveal similar pH-dependent unfolding mechanisms, albeit EFN while slightly less stable than LFN at neutral pH is slightly less sensitive to acidic pH conditions than LFN.
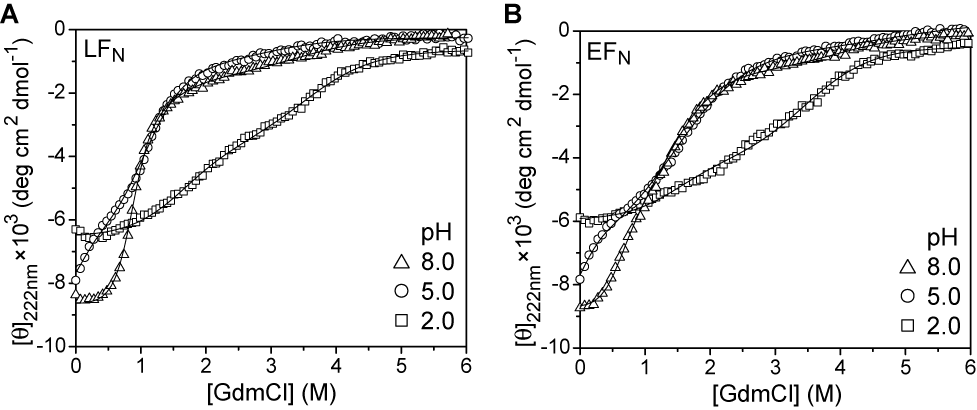
Fig 8. The pH dependence of the stability of LFN and EFN unfolding. Representative CD-probed equilibrium denaturation profiles at 20 °C for (A) LFN and (B) EFN at pH 8.0 (triangles), 5.0 (circles), and 2.0 (squares). The CD wavelength is 222 nm, and the denaturant is guanidinium chloride (GdmCl). Profiles are fit to a four-state model: N ↔ I ↔ J ↔ U.
This work reveals how a large folded domain could adopt an unfolded conformation that is ‘translocateable’ via a narrow transmembrane pore; importantly, these changes can occur in the absence of ATP-driven chaperones, which are not present in endosomes. Regardless as to whether the MG I state forms of LFN and EFN are either genuine equilibrium intermediates or more compact denatured states that contain significant “residual structure,” these structures—comprised of ~8000 Å2 of buried surface and about -8000 deg cm2 dmole-1 (CD222nm) of secondary structure content—must be either disassembled prior to or accommodated during toxin translocation. The translocation problem, therefore, should consider two key questions. (i) What is the balance of energetic factors that must be overcome upon the conversion of LFN from a soluble molten form to the “translocating form” that is passable via PA pore’s lumen? (ii) What are the steric or geometric constraints of polypeptide translocation through a lumen? Namely, which types of likely regular backbone polypeptide conformations can pass through the lumen? [top]
Using electrophysiology to monitor PA channel formation and LF translocation
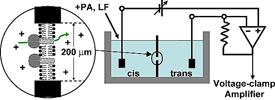
Fig. x. Planar lipid bilayer electrophysiology. Two compartments (cis & trans) are separated by a small hole, ~50 to 200 μm in diameter, wherein the membrane is formed. Each compartment contains a buffer with an electrolyte, like 100 mM KCl. Electrodes are connected to each compartment (via salt bridges). The membrane potential is controlled (clamped) and the current is amplified using a voltage-clamp amplifier. A channel-forming preparation (PA in this case) can be added to the cis side. Channel formation is monitored by step-wise increases in the current due to the insertion of individual channels into the membrane. (See BLM page also.)
Translocation through PA is monitored using a planar lipid bilayer (BLM) apparatus (Fig. w). First, PA is added to the cis compartment, where it inserts into the bilayer forming the cation-selective TC as monitored by the rise in K+ conductance. Then a substrate protein, LF or LFN, is added to the cis compartment to block the conductance. By changing the transmembrane driving force, [i.e., either by a proton gradient (ΔpH) (3) or membrane potential (Δψ) (4)], the substrate will be driven through the pore. Kinetic information on protein translocation over many timescales is reported by the restoration of the conductance. The observed ensemble protein transport kinetics are multi-exponential and complex. Additionally single molecule translocation studies are possible using a similar apparatus. [top]
Proton gradient-driven transport (ΔpH)
Hydrophobic phenylalanine clamp (φ clamp)
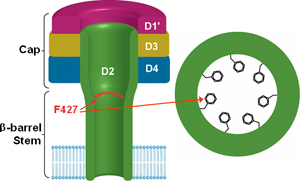
Fig x. Structural model of the φ-clamp site in PA.

Fig y. Substrate recognition by the φ-clamp site.